StoryMap JS

 Facts

Name: StoryMap JS
$: Free
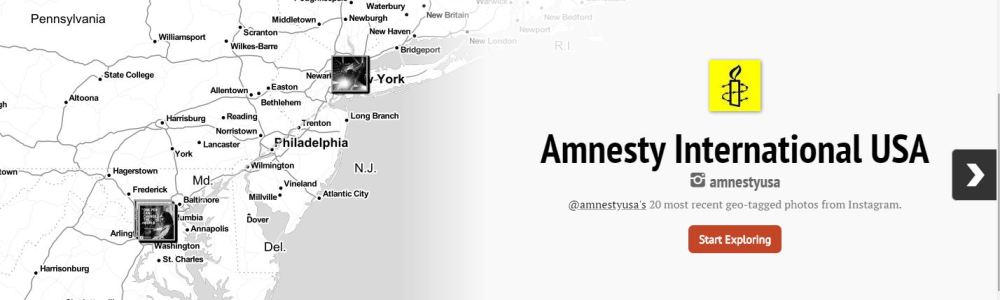
Example: Al-Raqqa Under Attack
Level: Beginners to Advanced depending on project complexity
Use For: Fast, rapid deployment; Visually representing research; Telling a story with a geographic component


About

StoryMap allows the user to design a map where the viewer is presented information about each location as they navigate through the map. The user can pick from a variety of basemaps, including OpenStreetMap, custom maps, and those designed by the user on Mapbox. The user then creates a title slide which shows the points from all the other slides. As the user creates slides they can choose the location the map zooms to and what kind of information they want attached to the slide. It is possible to add text, videos, including those from YouTube and Vine, photographs, including those from Flickr, tweets, excerpts from Wikipedia, and SoundCloud files.

When exploring the map the viewer can use the arrows on the side of the map to move from slide to slide in order or click on individual pins in the map to see the information associated with that location. The viewer can move around the map and can double click to zoom in on an area. It is not possible for the viewer to zoom out but they can move the map around.

StoryMap2

Simple versions of StoryMap can be created by those without prior mapping experience. Basic story maps can be created through the StoryMap JS authoring tool, however certain features can only be achieved through coding. For example, to override the automatic zoom settings for each slide the user must have knowledge of JavaScript. StoryMap is free for anyone to use. The maps can be viewed on desktop computers as well as mobile devices. They can be shared through a link or embedded in a webpage. StoryMap saves maps to Google Drive.

Gigapixel

Gigapixel is a part of StoryMap and allows the user to tell stories about large image files, such as photographs, artwork, or historical maps. To access Gigapixel the user creates a new StoryMap and chooses the Gigapixel option. The image that is exported and uploaded must be saved as tiles.

Google Products Overview

Google Maps

Google Maps is free and allows the user to choose from a variety of basemaps, upload files, and draw features onto the map.

Google Maps Engine

Google Maps Engine is similar to Google Maps but it has more capabilities and is not free. Google Maps Engine can support a wider variety of file uploads, more complex maps and has more sharing options.

Google Earth Pro

Google Earth Pro is the paid version of Google Earth. Unlike Google Maps and Engine it uses high quality satellite imagery and 3D imagery. The user can create maps, model new buildings, and create a video of 3D imagery.

Google Earth Tourbuilder

Google Earth Tourbuilder is free and uses Google Earth imagery to allow the user to create a tour.

Google Crisis Response

Google Crisis Response responds mainly to natural disasters. Often Google Crisis Response will have a resource page and host a crisis map with information from authorities and the crowd. Google Crisis Response also has a variety of products for responders.

Google Maps

Facts

Name: Google Maps
$: Free
Level: Beginners
Use For: Visualizing research; Activism


About

Google Maps allows the user to create maps visualizing data. There are a variety of basemaps the user can choose from. Layers can be added by importing data or drawing data onto the map. The user can import files that are CSV, XLSX, or KML. The user can draw points, lines and shapes onto the map and give these features a title and description. If the user has a particular location where they would like to place a point they can find it using the search bar. The user can add walking, biking and driving routes or use the add directions option which allows the user to include Google directions in the map. There is also a measure distance and area tool.

Maps can be viewed on desktop or mobile devices. Maps are saved in Google Drive and the user has control over the map privacy settings. Other people can be invited to view or edit the map. Maps can also be shared through a link, printed, turned into a KML file or embedded. Google Maps is particularly well suited for communicating the path of a march or the location of a human rights event. For more advanced mapping and sharing options the user can use Google Maps Engine.

The one million tweet map

Facts

Name: The one million tweet map
$: Free
Level: Beginners
Use For: Visualization of social media response; Campaigning


About

The one million tweet map allows the user to visualize and explore the last one million tweets. The user can choose between a cluster and a heatmap view. The user can also filter the results by keyword or hashtag. The side panel displays the five most popular hashtags. The hashtags change to reflect the tweets shown given the zoom level and the filter settings. Bubbles that have a 1 in them represent one tweet and the viewer can click on the bubble to read the tweet. The one million tweet map can be used to explore where a hashtag is being used and  where people are talking about a recent news event. Since the one million tweet map is constantly updating, the best way to capture a specific moment in time is through a screenshot.

TweetMap


Maptimize

The one million tweet map is produced by Maptimize. Maptimize offers big data rendering for online maps to improve navigation and filtering. The product works with OpenStreetMapLeaflet, Google Maps, and Bing Maps.

Trendsmap

Facts

Name: Trendsmap
$: Varies
Example: Outrage After CIA #TortureReport Release
Level: Beginners
Use For: Visualization of social media response; Campaigning


About

Trendsmap allows the user to visualize and explore the latest global and local twitter trends. Free accounts can view a limited number of twitter trends. Basic accounts cost $9 per month and $90 per year. The user gains access to top users, videos, images and links. Plus accounts cost $19 per month and $190 per year. The user gains access to 5 times more trends, 4 more levels of zoom and a 7 day history of trends. The user is also able to view top videos, images and links for each trend and filter by words, users and hashtags.

Trendsmap1

Trendsmap also has a range of visualization tools that can be used to generate maps. Trendsmap can be used to explore where a hashtag that is being promoted is being used and what is being said about it. It can also be used to visualize where people are talking about a recent news event, as shown in the example. Some paid accounts have the option to embed Trendsmap, however other organizations have just taken screenshots of the map. The map is constantly changing so a screenshot is the easiest way to preserve the trends at a certain point in time.

OpenHeatMap

 Facts

Name: OpenHeatMap
$: Free
Examples: OpenHeatMap Gallery
Level: Beginners
Use For: Rapid data visualization


About

OpenHeatMap allows the user to create a map of the information in any Excel or CSV file, including those on Google Drive. The website automatically turns the spreadsheet into a map. The spreadsheet must contain location information and values for the locations. A list of compatible types of locations can be found here. It is possible to use OpenHeatMap to create a map that shows how an attribute changes over time. To do this there must be a time column in the spreadsheet that is uploaded.

OpenHeatMap1

The user is able to change the colors and transparency of the visualization. For point data the user is also able to chose between circles or blobs and change the size of each point. If the values associated with the locations are all the same then the locations will all be the same color.The viewer is able to zoom in and out on different areas of the map. When the viewer mouses over the map they are able to view the mapped value associated with the location and any other values in the spreadsheet that were associated with the location.

OpenHeatMap2

This map can be created by those without prior mapping experience. OpenHeatMap is free for anyone to use and can be viewed on desktop computers as well as mobile devices. It can be shared through various social media platforms or embedded.

SnapMap

 Facts

Name: Snapmap
$: Free
Example: Amnesty International USA’s SnapMap
Level: Beginners
Use For: Fast, rapid deployment; protests, marches, activism


About

SnapMap allows the user to create a map of any public Instagram account’s 20 most recent geo-tagged photographs. The map walks the viewer through the photographs from the oldest to the newest. Below each photo is the caption, any hashtags, how many likes the photograph received and how long ago the photograph was posted. It is not possible to change the order of the pictures on SnapMap. The geo-tag of an Instagram photo is set during the photograph upload process and cannot be changed once the photograph is posted. It is possible to zoom in on the map by double clicking, but it is not possible to zoom out.The viewer can examine photos out of order by clicking on the individual photograph, instead of the arrows on the side of the page. SnapMap can be used to document an Instagram user’s photographs of a human rights event with a geographic component, such as a march or protest.

Snapmap Example

SnapMaps can be created by those without prior mapping experience. SnapMap is free for anyone to use and can be viewed on desktop computers as well as mobile devices. The map can be embedded in a website or a link to the map can be provided. SnapMaps continuously change as new geo-tagged photographs are added to Instagram. To preserve a SnapMap of specific photographs the Snapmap can be exported to StoryMap JS. Exporting the map to StoryMap JS also allows the user to change the type of map displayed, edit the text below the photographs, reorder photographs, change the photograph location, and delete photographs.